Mind the Learning Gap: A Methodological Look into World Bank’s New Human Capital Index
This NORRAG Highlights is written by Ji Liu, NORRAG Research Associate, PhD Candidate and Doctoral Fellow at Teachers College, Columbia University on the occasion of the launch of the World Development Report 2019: The Changing Nature of Work. In this post, the author looks at the World Bank Group’s new Human Capital Index (HCI) which quantifies the contribution of health and education to the productivity of the next generation of workers. The author looks specifically at the education component of HCI and formulates cautionary notes on its use and interpretation.
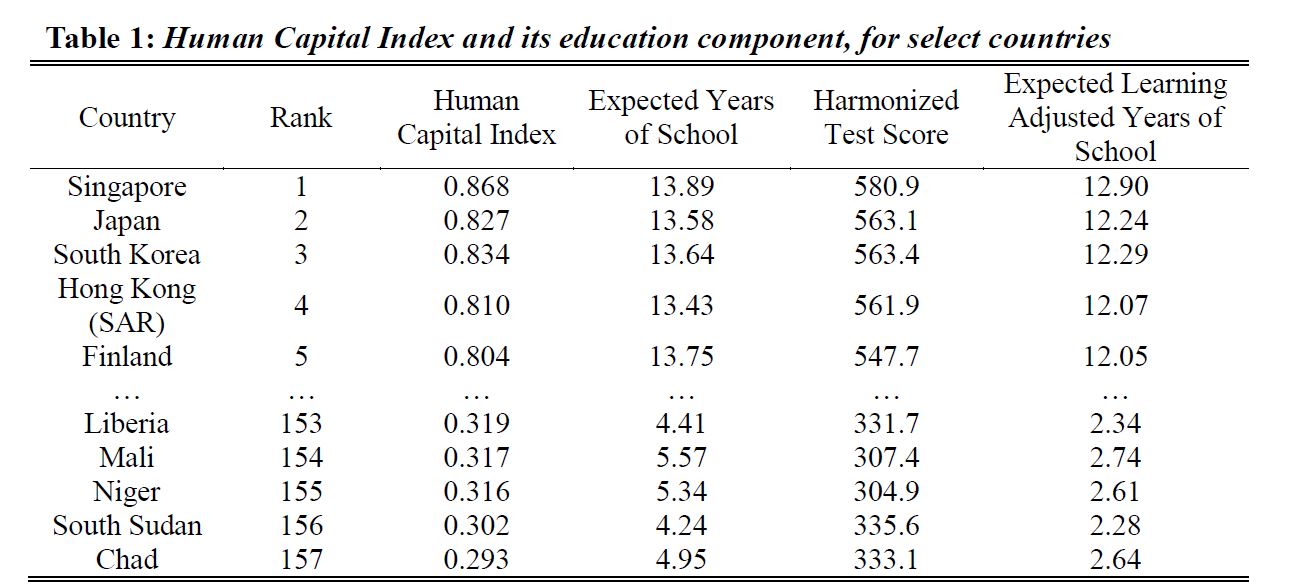
The World Bank Group recently released its brand new Human Capital Index (HCI) covering 157 countries and economies, as part of a global call-to-action to investing more in people. This newest addition in the Bank’s human capital portfolio is intended to help countries keep track of the progress they make in education and public health, or lack thereof. The index is composed of three key components: expected survival, expected learning-adjusted years of education, and expected health. Altogether, the index indicates the level of human capital that a child born today can expect to attain by age 18. For instance, given a HCI score of 0.868, a child born in Singapore today can expect to be 86.8% as productive as she could be when she turns 18 years old, whereas the same productivity expectation at age 18 is only 29.3% for a child born in Chad today (see Table 1).

Data Source: (World Bank, 2018), author’s compilation.
Understanding the education component of HCI
According to the Bank’s (2018) technical note, HCI’s education component attempts to capture both quantity and quality dimensions of educational performance at the system-level. On the one hand, education quantity is measured as the amount of education in years a child can expect to obtain by the age of 18, which is calculated as the sum of age-specific enrollment rates between ages 4 to 17. On the other hand, quality of education is tracked using a new Harmonized Test Score (HTS) dataset that synchronized results drawn from major international and regional student achievement testing programs, including TIMSS, PISA, PIRLS, SACMEQ, EGRA, etc.
Combining both strands of information, the Bank calculates expected learning-adjusted years of school for each country by multiplying a countries’ school expectancy by the ratio of each country’s HTS score to a Bank-defined HTS benchmark score, which is 625 TIMSS-equivalent points. In the case of Chad’s result computation, its HTS score of 333.1 is divided by the benchmark score of 625, which derives a ratio of approximately 0.533 indicating that schools in Chad delivers roughly half of the learning that the “complete high-quality education” benchmark (World Bank, 2018, p.7) can in one year. Multiplying 0.533 by the expected years of school in Chad (4.95 years) will correspond to Chad’s expected learning adjusted years of school (2.64 years). Following the Bank-defined “complete high-quality education” at 14 learning adjusted years of school, students in Chad are expected to have more than 11 years of learning gap by the time they reach 18 years old!
To sum up general predictions of HCI’s education component computation, the higher a country scores on international or regional testing programs, the more “efficient” its education system is considered by the HCI formula to be at delivering learning.
Important but unanswered questions for the HCI
-
- How should we interpret the education quality component of HCI?
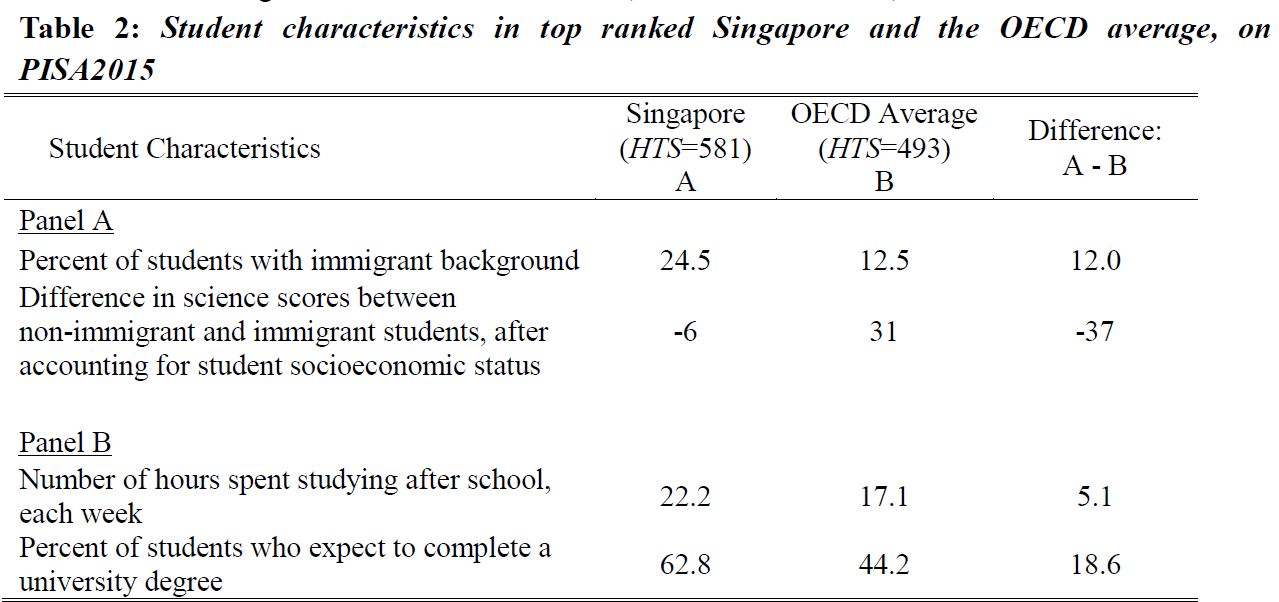
A main assumption of the Bank’s HCI calculations is that country-level student learning results are mostly, if not entirely, attributable to better education policy or instruction or more resources when students are in school. However, theoretical explanations of the education production function and large bodies of empirical evidence have both indicated that student achievement is influenced by a mixture of school-related and non-school-related factors. In other words, without accounting for the composition of the student population, educational investments made at home, and how ready students are when they enter school systems, the value-added benefits of schooling and education policies become difficult to assess. As a result, outstanding performance highlighted by stellar HTS scores may not necessarily reflect the soundness of education policy, investments, or instruction alone, but also demonstrate more favorable conditions outside of school. To make things clear, I illustrate some potential complications below:- First, student demographic composition is very different across countries. Using top performing Singapore as an example, we can observe that its student population differs substantially from that of the OECD average on several key dimensions (see Table 2). For instance, not only are there proportionally more students with immigrant background in the Singaporean student population, but they also have very different background traits, e.g. socio-economics. To illustrate, as compared with immigrant students in the OECD, immigrant students outperform non-immigrant students by 6 points in Singapore, whereas immigrant students on average score 31 points lower than non-immigrant students in the OECD (see Table 2, Panel A).

Data Source: (OECD, 2015), author’s compilation
- Second, the level of family educational inputs, which substantially affects student learning, is likely to be heterogeneous in different contexts. In many top performing countries/economies on HTS, including Singapore, Japan, South Korea, Hong Kong, private investments in shadow education is substantial. For instance, in the PISA 2015 sample, OECD students spend about 5 hours less outside of school studying each week, relative to students in Singapore (see Table 2, Panel B); this weekly gap in after-school educational inputs potentially amount to large differences over the duration of a student’s academic career. To add, family expectations of student educational achievement are vastly different: in Singapore, more students (63 percent) report that they expect to complete tertiary education than do students in the OECD (44 percent).
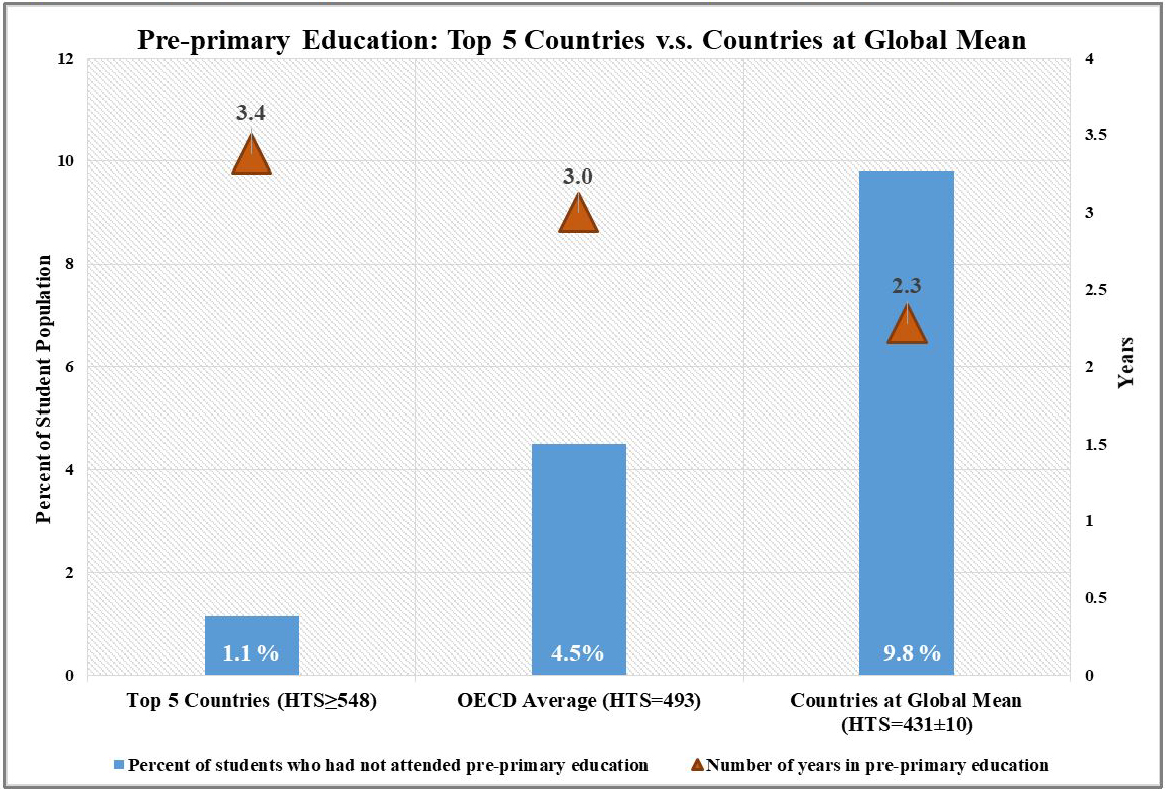
- Third, while education is publicly supported in many countries, pre-primary education remains a family decision in many parts of the world, and access to these programs varies greatly. For instance, students in Top 5 countries on average report 3.4 years of pre-primary education attainment, compared to only 2.3 years for students in countries at the HTS global mean (see Figure 1). This is an attainment gap of 1.1 years of additional school, even before entry to primary education. In addition, close to one-in-ten students (9.8 percent) in countries at the global HTS mean report not attending pre-primary education at all, while the same number is 1.1 percent in Top 5 countries.
Figure 1: Top performing countries have substantially better pre-primary education coverage
Data Source: (OECD, 2015), author’s compilation. Note: Top 5 countries/economies with highest harmonized test scores are Singapore, Japan, South Korea, Hong Kong (SAR), and Finland. Five countries close to the global HTS mean are: Colombia, Costa Rica, Mexico, Montenegro, and Qatar.
- First, student demographic composition is very different across countries. Using top performing Singapore as an example, we can observe that its student population differs substantially from that of the OECD average on several key dimensions (see Table 2). For instance, not only are there proportionally more students with immigrant background in the Singaporean student population, but they also have very different background traits, e.g. socio-economics. To illustrate, as compared with immigrant students in the OECD, immigrant students outperform non-immigrant students by 6 points in Singapore, whereas immigrant students on average score 31 points lower than non-immigrant students in the OECD (see Table 2, Panel A).
- How should we interpret the education quality component of HCI?
- Are international student assessments comparable across test-programs?
As explained in the Bank’s HTS methodology note, the HTS ratio linking approach assumes that the country participation overlap in PISA and TIMSS maps precisely to their target population overlay. However, PISA’s target population is 15-year-old students, whereas TIMSS samples only students in Grades 4 and 8. According to IEA (2015), the average age of tested 8th grade students in TIMSS 2015 range between 13.8 and 14.5 years old among most participant countries, which is about one full year less than that of PISA’s average age (OECD, 2015). This type of difference exists even within the same country that participated in both PISA and TIMSS in the same wave, making the Bank’s HTS conversion problematic. Moreover, the HTS methodology assumes that test objective and item-type are indifferent between PISA and TIMSS. To this end, TIMSS 2015 is designed to be curricular valid across countries, while PISA is based on a more general concept of “life skills and competencies.” As a result, PISA test items tend to be more often embedded in lengthier text than typical items on TIMSS, whereas TIMSS has been shown to administer more short and multiple-choice items. Therefore, without accounting for test objective and item-type variations, the HTS procedure would bias the conversion result as long as there is variation in overlapped countries’ relative performance on either PISA or TIMSS. - Are international student assessments comparable across test-years?
Mode effects of test-administration type have been extensively documented in the assessment literature that substantial differences in results exist between paper & pencil and computer-administered tests. In particular, students in 58 countries and regions participated in the computer-administered PISA 2015 (another 15 countries administered the paper and pencil version), while all TIMSS 2015 testing was exclusively conducted on paper. Using data from PISA 2015-trials, Jerrim et al. (2018) have shown that students who completed the computer-based version performed consistently worse than those who completed the paper-based test, with differences up to .26 standard deviations. This computer-administration induced score penalty equates almost a full year of schooling according to OECD (2015) guidance on test points to years of schooling conversions. Therefore, HTS conversions across years without accounting for the differences in mode of test-administration effect will inevitably bias the results, and make cross-country comparison results unreliable.
Way forward: applaud the strategic shift, but caution the new index
As the World Bank’s flagship publication World Development Report 2018 points out, too often meaningful learning is absent in schools. To this end, the Bank’s renewed interests in human capital and education, and its global call-to-action to investing in people marks an important milestone. However, the new Human Capital Index, which sits at the core of the Bank’s education agenda, requires a cautionary note in its use and interpretation, and leaves critical room for improvement. Importantly, the questions posed in this note suggest that results on HCI’s education component may not be fully attributable to education policy or instruction alone, but may reflect more favorable conditions outside of school.
While the index’s calculations and availability of new data offer fresh tools to measure and compare learning, the level of complexity that is embedded in cross-national comparisons is not being fully accounted for in its current form. For one, the underlying student population in each context varies on multiple dimensions, making the current test score harmonizing and linking methodology problematic, and justifies the need for adjustments based on student population characteristics. For another, comparability issues arise with inter-program and inter-temporal analysis, and point to the need for more research and methodological innovations that can better align test-items for greater comparability. To be clear, the new Human Capital Index will inevitably make big ripples in how countries prioritize educational investments in the near future and beyond. Nonetheless, giving thoughtful considerations to the caveats noted above will help the Bank mark clear boundaries to which results of this index apply, and at the same time, strengthen the applicability of policy recommendations to different contexts and actors.
About the author: Ji Liu, https://www.norrag.org/our-team/
Contribute: The NORRAG Blog provides a platform for debate and ideas exchange for education stakeholders. Therefore if you would like to contribute to the discussion by writing your own blog post please visit our dedicated contribute page for detailed instructions on how to submit.
Disclaimer: NORRAG’s blog offers a space for dialogue about issues, research and opinion on education and development. The views and factual claims made in NORRAG posts are the responsibility of their authors and are not necessarily representative of NORRAG’s opinion, policy or activities.


Ji Liu’s blog does the development community a service by pointing out some of the problems with the Bank’s new HCI. However, Liu’s critique does not go far enough. The HCI distorts efforts to reach SDG4 targets and undermines the right to education. Moreover, even if there was some validity to thinking only about the potential of education to improve economic productivity there are so many fundamental flaws with the HCI that its rankings are totally invalid: test scores are not comparable across countries; the test score benchmark is arbitrary; there is no productivity connection that makes it rational to multiply years of schooling by this mismeasured learning deficit; there is no correct way — or even approximate way — to translate the learning-adjusted schooling measure to the foregoing of potential income; and even if there were, foregone income has little to do with productivity. See David Edwards blog on HCI for more criticisms!
https://worldsofeducation.org/en/woe_homepage/woe_detail/16022/what%27s-wrong-with-the-world-bank%27s-human-capital-index-by-david-edwards
Steve Klees
University of Maryland
Pingback : NORRAG – Shifting the Supply and Demand for International Large Scale Assessments by Ji Liu and Gita Steiner-Khamsi - NORRAG -