
Measuring Learning: the Cost of Ignorance By Silvia Montoya
Silvia Montoya, Director of the UNESCO Institute for Statistics
 Let’s be honest. For the past few months, we – the international education community – have been celebrating the victory in getting governments to adopt the ambitious Sustainable Development Goal 4 to provide inclusive and equitable quality education for all. But the party is over and now we face the enormity of ensuring that all children and youth are in school and learning by 2030. Where do we begin?
Take a look at my job title and guess my response: Data. Five of the seven new education targets concentrate on learning. Many countries already invest in learning assessments, while others are looking to follow suite. The problem is that the resulting data cannot be compared internationally and are not necessarily designed to meet the specific needs of countries.
So the first order of business is to develop the measurement frameworks needed to produce reliable measures of learning at different levels of education that can be compared across countries, time and disaggregated by age, sex, disability, socioeconomic status, geographical location and other factors.
Now let me guess your response. “Sounds great but how much will it cost?” I admit this question has kept me up more than a few nights. Once again, think back to my job title – Director of the UNESCO Institute for Statistics (UIS), which has been given the mandate to develop these new frameworks and coordinate the production of the new data.
The good news is I can now sleep soundly. After a lot of number-crunching and analysis, I can report that learning assessment data will cost pennies compared to the cost of ignorance. A new UIS paper presents several approaches, but the bottom line is most apparent when we consider the inefficiencies that are currently plaguing education systems compared to benefits that could arise from the use of assessment data.
Table 1 presents the actual amounts governments are spending to get a student to graduate from secondary school, compared with the savings they could make by reducing repetition and dropout rates throughout primary and secondary education (theoretical expenditure).
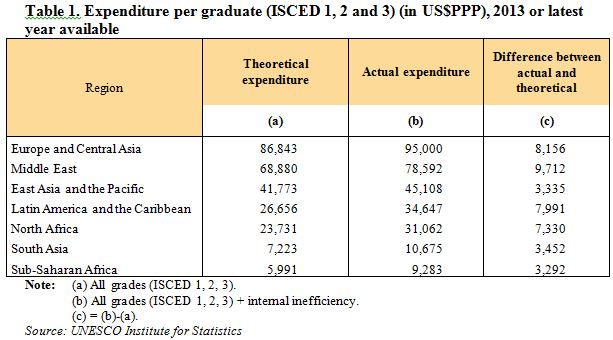
So in sub-Saharan Africa, for example, about one-third of the money currently spent per graduate is due to inefficiencies in the system. There are many reasons why it takes longer for some students to graduate, and some of these factors are beyond the scope of the education systems. But at a minimum, every government needs accurate data to answer some key questions: Who is learning what and who isn’t? Where, when and why?
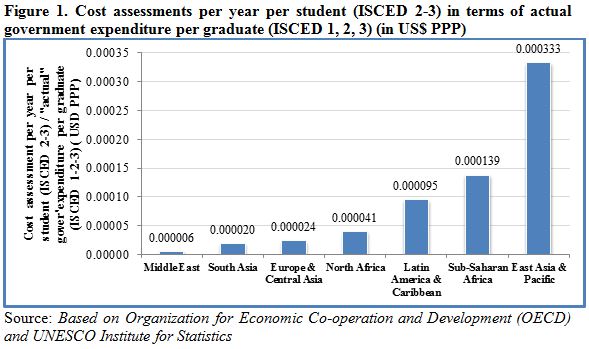
So let’s continue our economic analysis by considering how much it would cost to assess the skills of students at three levels in their education (by participating in TIMSS, PISA and EGRA) in relation to what governments are actually spending per graduate. To conduct these three assessments, it costs about US$110 per student in a sample size of about 3,000. Now let’s consider this cost in relation to the total amounts governments are actually spending on each student that completes secondary education. As shown in Figure 1, the additional assessment costs spread over the entire student population amount to pennies in relation to actual spending per graduate. For example in South Asia, the actual spending per graduate would rise by just US$ 0.00002 to regularly assess (every three to five years) the skills of students based on a reasonable sample size.
How much does it cost NOT to test?
So far, we have focused on efficiency – or what it would cost to produce the data to “do things right”. But more importantly, education systems must be effective and “do the right things”. Just imagine how frustrating it would be to discover that, after all the years of effort, students are not prepared for higher education or meaningful employment. So to be effective and efficient, we don’t just need statistics – we need comparable data, gathered under the same framework with aligned methodologies and reporting criteria to avoid bias.
So how much does it cost NOT to conduct learning assessments? Let’s take a more macro view based on the projection model of Hanushek and Woessmann, which looks at the growth in gross domestic product (GDP) that can arise from improvements in the skills of a population, measured by PISA (see Figure 2). The projection period spans 80 years to reflect the life expectancy of someone born in 2015.
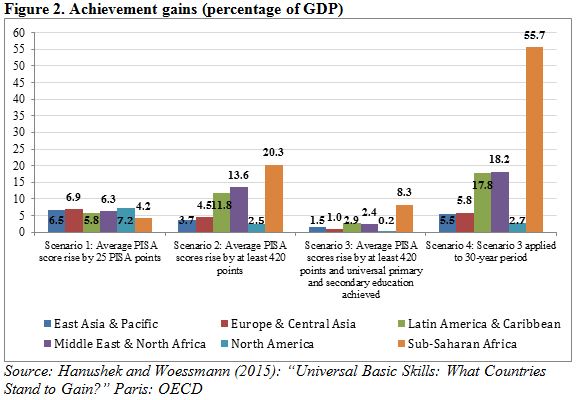
According to this model, Europe & Central Asian countries with 100% enrolment rates that manage to improve their PISA scores by 25 points between now and 2030 will see a rise in GDP of 6.9% over the next 80 years. So by 2095, the annual GDP would be 28% higher than that expected with today’s skill levels. Of course, the total value of the added GDP differs by the size of the economy, so that the Germany, for instance, would see present value of gains of over US$ 12.7 trillion, while much smaller Montenegro would see gains of US$ 34 billion.
What country can afford to forego these potential gains? Clearly, the cost of not assessing learning grossly outweighs the cost of conducting an assessment or putting a child through school. Most importantly, what country can take the risk of not providing students with the skills needed to compete in the labour market?
Remember the old saying: “If you think education is expensive, try ignorance”. Well now we have a new twist: “If you think education data are expensive, try doing without.”
Silvia Montoya (@montoya_sil) is the Director of the UNESCO Institute for Statistics (@UNESCOstat).
NORRAG (Network for International Policies and Cooperation in Education and Training) is an internationally recognised, multi-stakeholder network which has been seeking to inform, challenge and influence international education and training policies and cooperation for almost 30 years. NORRAG has more than 4,500 registered members worldwide and is free to join. Not a member? Join free here.
Hello Ms. Montoya,
The data are very interesting. But what evidence do you have to show that learning improvements are due to feedback from tests? Which countries, particularly low-income countries, have used test data to actually improve learning in class?
My thoughts on this issue are in a blog I wrote recently. I will be very happy to engage in a dialogue.
https://varlyproject.wordpress.com/2016/01/17/has-the-data-revolution-thrown-learning-outcomes-off-the-bus/
Pingback : Through Aditi’s Eyes: The Importance of Early Grade Assessment in Tracking Children’s Learning | NORRAG NEWSBite
Pingback : The Cost of Ignorance Revisited: Imitating the OECD or Learning to Be Critical? | NORRAG NEWSBite
Pingback : Norrag The Cost of Ignorance Revisited: Imitating the OECD or Learning to Be Critical? - Norrag
Pingback : NORRAG – Through Aditi’s Eyes: The Importance of Early Grade Assessment in Tracking Children’s Learning By Hannah-May Wilson - NORRAG -
Hello Ms. Montoya,
The data are very interesting. But what evidence do you have to show that learning improvements are due to feedback from tests? Which countries, particularly low-income countries, have used test data to actually improve learning in class?
My thoughts on this issue are in a blog I wrote recently. I will be very happy to engage in a dialogue.
https://varlyproject.wordpress.com/2016/01/17/has-the-data-revolution-thrown-learning-outcomes-off-the-bus/